This is a short reflection—or rather, a call for action—so procurement lawyers and economists start thinking a bit differently about procurement data in more exciting ways, and hopefully in a way that can excite data scientists too.
I have just read the paper by A Agrahari and SK Srivastava, ‘A Data Visualization Tool to Benchmark Government Tendering Process: Insights From Two Public Enterprises ‘ (2019) 26(3) Benchmarking 836-853 (abstract available at SSRN: https://ssrn.com/abstract=3451789, full paper is paywalled). The paper caught my eye because I have recently been thinking about the possibilities that could be unlocked by imminent increases in the volumes of procurement data publicly available, in particular as a result of the new EU rules on eForms (due to be transposed by end 2022) and the increased uptake of OCDS and similar open data initiatives—that is, once current efforts to create an enabling data architecture start to bear fruit.
Not to mince words, I was rather disappointed to read the paper and realise that there is no real data visualization tool (beyond really basic excel graphs) and that the only information the authors decided to use to support procurement management recommendations mainly concerns periods of time (for tender submission, tender evaluation, etc) as well as very limited formal aspects (such as how many different types of tender sureties were accepted). The most advanced insight in the paper concerns a trend analysis of expiry of tenders during evaluation (below), which is hardly ground-breaking (but still, of some internal use for the procuring entites in question and, perhaps, for external audit bodies, I guess).
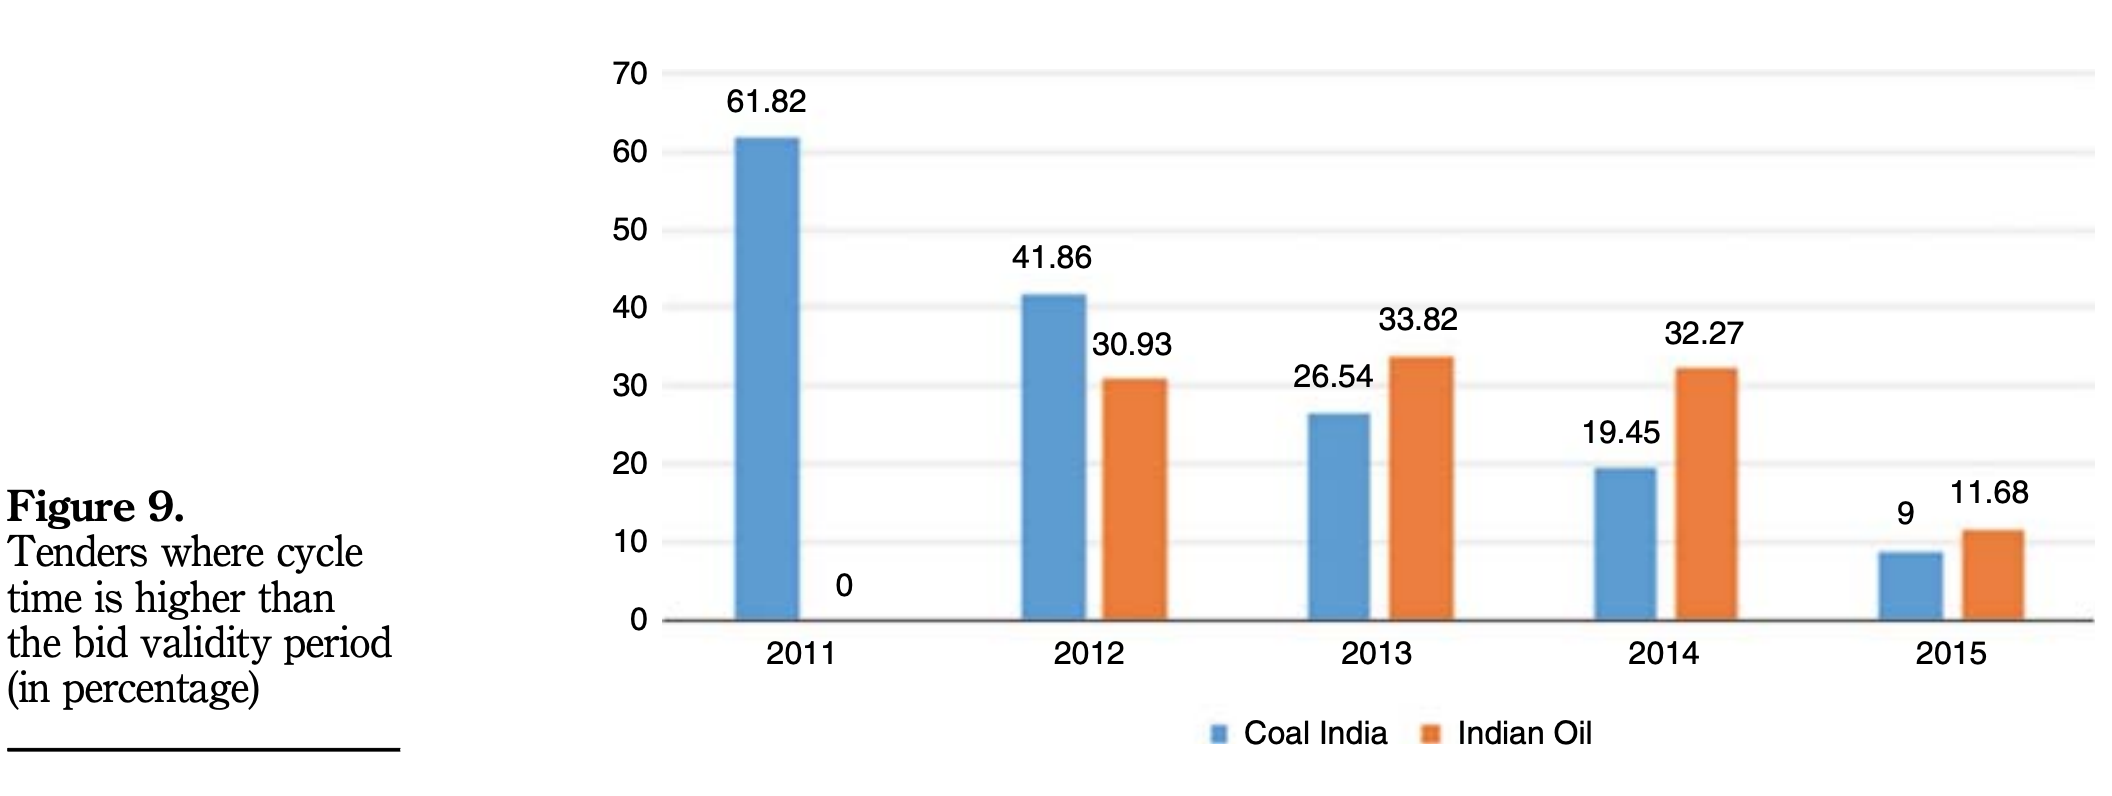
Agrahari & Srivastava (2019: 848).
The paper made me keep thinking, though. And the realisation I arrived at is that we need to get the data scientists excited about procurement because lawyers, public managers (and to a large extent, economists) will probably lack the imagination to put the vast volumes of procurement data about to be unlocked to its most effective use. I guess this goes back to general issues of inertia, group-think and professional acculturation.
To be sure, there are quite a few quick improvements to be introduced in a host of legal and economic analyses of the procurement function once reliable data is available (in particular in terms of monitoring and compliance, within the boundaries of Regtech and automated audits), but the more transformative uses of data will probably come from those that can understand the potential in the information (like the statute inside the marble block, I guess), rather than being bounded by the real-world / day-to-day problems that tend to skew our understanding of procurement.
When you look at other areas with an abundance of data, some of the data visualisations are truly amazing (a quick Google search will support this) and have the power to encapsulate the insights from unimaginable volumes of information into very powerful messages. One that keeps blowing my mind is the below visualization of New York City trees by Cloudred (it is interactive, so please go and browse the real thing).

Cloudred.
It seems to me that this type of very visual analysis could (and should!) be applied to procurement in a myriad different forms, eg to compare expenditure per capita across different locations, to compare mix of expenditure across contracting authorities or departments, as well as to check a for a multitude of policy-relevant issues. For example, I imagine a similar interactive graph to represent the holy grail of cross-border procurement interactions in the EU single market, or in the context of free trade agreements … it should also be possible to use similar visualisations to identify different entities holding similar assets (which could then be pooled traded, etc) … and I am a rather unimaginative lawyer, so data scientists that got excited about the potential of this field could probably takes us rather far.
Now, the question is, how can we get data scientists excited about procurement?
Of course, we cannot just hope that they will one day discover the unexploited value of procurement data. And it may well be that we need to make an effort to help them understand what procurement is about and what ultimate and more immediate goals it aims to serve, so that they can start to imagine for us the relevant data expressions and the way to construct them. I guess that the first step is probably for us to get excited about data ourselves, so that we can make that contagious.
I think there is a data visualisation challenge to be launched and I would be really excited to be part of making it happen. I just need to find someone with a deep pocket willing to fund it. In the meantime, and more modestly, perhaps we can get a conversation going on what you would like procurement data to be used for and how you imagine it could be done (or even if you cannot imagine it).
I am curious to read about your suggestions in the comments section—or by email at a.sanchez-graells@bristol.ac.uk, if you think there is some app to developed that you would not want to give away for free.
Postscript: a couple of twitter updates
Two interesting sets of materials have been pointed to me on twitter:
Materials from the “Superpowers of procurement data“ conference (30-31 May 2018) [thanks Lyndsey Wray, @UKBidWriter]
Outputs of a H2020 funded project on “Enabling procurement data value chains ...“ (from 2018 and 2019) [thanks Gavin Hayman, @GavinHayman_GW]